Dans ce tutoriel, nous décrirons comment Centreon peut superviser des conteneurs Docker orchestrés au sein d’un cluster Kubernetes.
Kubernetes est la solution d’orchestration de conteneurs en production la plus répandue pour le déploiement d’applications et de microservices conteneurisés. Et Prometheus s’avère pratique en tant qu’unique point de collecte et d’agrégation de mesures pour les trois niveaux de votre environnement microservice : les nœuds Kubernetes individuels, le cluster Kubernetes et les applications.
Dans cet article de blog, nous montrerons comment les plugins et Plugin Packs Centreon permettent de faciliter la supervision d’un cluster Kubernetes via un serveur Prometheus. Nous commencerons par introduire Kubernetes et Prometheus. Puis, nous installerons et testerons le plugin Kubernetes. Enfin, nous montrerons comment utiliser le Plugin Pack pour superviser un cluster Kubernetes avant de préciser les différentes métriques disponibles sur la plateforme Centreon.
** La suite de cet article et le tutoriel sont rédigés en anglais **
1. A quick introduction about Kubernetes and Prometheus
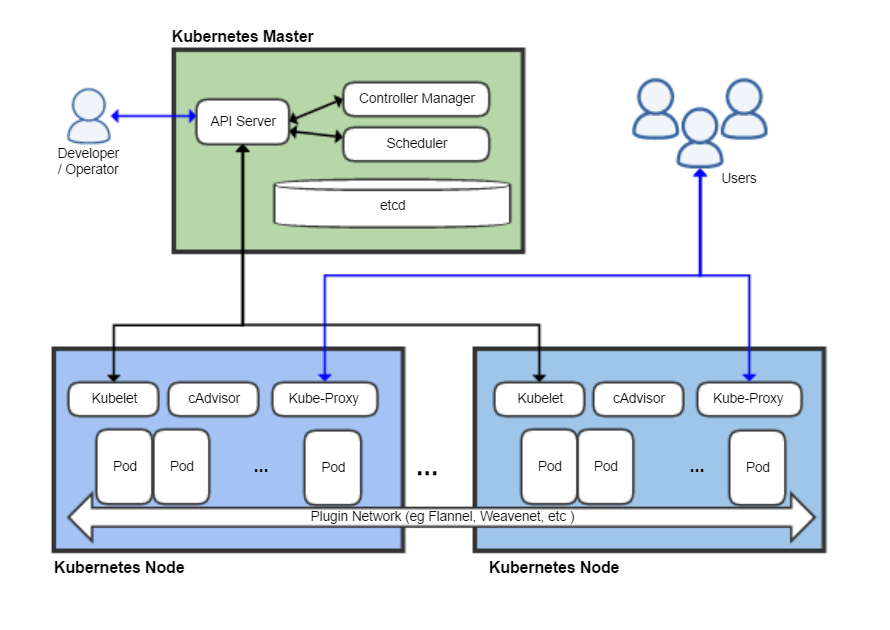
Kubernetes is an open-source orchestration system for automating application deployment, scaling, and, management running in a containerized environment. Its development and design are heavily influenced by Google’s Borg system, referring to the character Seven of Star Trek TV show, which also explains the seven spokes on the wheel of the Kubernetes logo. It is now maintained by the Cloud Native Computing Foundation.
It consists of multiple complementary primitives that allow Kubernetes to automatically administer the lifecyle of containerized applications across a cluster of nodes.
The key objects are:
| Nodes, Clusters and Namespaces | Nodes are physical or virtual machines running multiple Docker containers. A Cluster is made of a master node which orchestrate applications and multiple worker nodes who execute them. Namespaces are virtual clusters backed by a physical cluster. |
| Pods & Containers | The basic scheduling unit in Kubernetes is a pod. It adds a higher level of abstraction by grouping containerized components. A pod consists of one or more containers that are guaranteed to be co-located on the host machine and can share resources. |
| Deployments, Replica Sets, Daemonsets | Deployments specify how to execute and operate an application. Deployments scale up and down pods and Replica Sets to reach a desired state for the application. Replica Sets orchestrate pod creation, updates and deletion. Daemonsets are used for background tasks or daemons that must run on all nodes: when adding a node to a cluster, the pods in a Daemonset are automatically started on that node. |
Prometheus is an open-source Time-Series Database (TSDB) and a graduated project of the Cloud Native Computing Foundation, along with Kubernetes. Several assets makes it convenient to monitor microservices in a Kubernetes environment:
- It excels at organizing data using labels, a good fit to Kubernetes own infrastructure metadata organization.
- It includes its own mechanism to scrape data (to pull data, in Prometheus parlance) from all key components in a microservice architecture
- It provides several methods to automatically discover targets to be scraped, a key asset in very dynamic environments
Prometheus scrapes raw data typically every 15 seconds, from exporters residing on Kubernetes nodes or from the services themselves. Centreon pulls consolidated metrics, typically every 5 minutes, using Prometheus flexible PromQL query language.
In this tutorial, we’ll assume your Kubernetes cluster is up and running and you have already installed and configured a Prometheus server that scrapes kube-state-metrics. The Prometheus documentation is a good place to start if you need more info on this topic.
What will we monitor about our Kubernetes Cluster ?
- Namespaces: are my virtual clusters all available?
- Nodes: are all the nodes in the cluster ready to schedule pods?
- Deployments: are my deployments running according to their desired state?
- Daemonsets: are my daemonsets up and running on all nodes?
- Pods: how is the number of pods in each state (ready, running, terminated, waiting) evolving along the time, what are the reasons for terminated or waiting states, how is the number of restarts evolving?
Let’s start by installing and testing the Centreon Plugin before monitoring with the Plugin Pack.
2. Installing and Testing the Prometheus-Kubernetes Centreon Plugin
Kubernetes is monitored by the centreon-plugin-Cloud-Prometheus-Kubernetes-Api Plugin, which belongs to the open source Centreon Plugin library and is thus available from the Centreon standard repository.
Use the CentOS7/RedHat 7 yum command to install the plugin package from Centreon repository. This should be done on any Poller that queries the Prometheus server:
yum install centreon-plugin-Cloud-Prometheus-Kubernetes-Api.noarch
This will automatically install the required Perl dependencies:
DateTime
JSON::XS
URI::Encode
It’s always a good practice to first test the plugin from the Command Line Interface, at the minimum to verify the connection to the Prometheus server.
So let’s make sure we can connect to the Prometheus’ API by running a command line to list all nodes of the cluster, using the list-nodes mode:
/usr/lib/centreon/plugins/centreon_prometheus_kubernetes_api.pl --plugin=cloud::prometheus::direct::kubernetes::plugin --mode=list-nodes --hostname=amzprometheus.int.centreon.com --url-path='/api/v1' --port='9090' --proto='http'
List nodes:
[node = amzkubemaster.int.centreon.com][os_image = CentOS Linux 7 (Core)][kubelet_version = v1.13.3][kubeproxy_version = v1.13.3][kernel_version = 3.10.0-957.5.1.el7.x86_64][container_runtime_version = docker://18.9.2]
[node = amzkubenode1.int.centreon.com][os_image = CentOS Linux 7 (Core)][kubelet_version = v1.13.3][kubeproxy_version = v1.13.3][kernel_version = 3.10.0-957.5.1.el7.x86_64][container_runtime_version = docker://18.9.2]
[node = amzkubenode2.int.centreon.com][os_image = CentOS Linux 7 (Core)][kubelet_version = v1.13.3][kubeproxy_version = v1.13.3][kernel_version = 3.10.0-957.5.1.el7.x86_64][container_runtime_version = docker://18.9.2]
- –hostname is the name of your Prometheus server, default –port is 9090
Good! We got the list of our three Kubernetes nodes and their software versions.
Let’s do a last test and use the plugin to actually check the cluster’s nodes. This is done with the node-status mode:
/usr/lib/centreon/plugins/centreon_prometheus_kubernetes_api.pl --plugin=cloud::prometheus::direct::kubernetes::plugin --mode=node-status --hostname=amzprometheus.int.centreon.com --url-path='/api/v1' --port='9090' --proto='http' --node='node=~".*"' --warning-status='' --critical-status='%{status} !~ /Ready/ || %{schedulable} =~ /false/' --warning-allocated-pods='' --critical-allocated-pods='' --units='' --verbose
OK: All nodes status are ok | 'allocated_pods_k8s-kube-master'=25;;;0;110 'allocated_pods_k8s-kube-node1'=55;;;0;110 'allocated_pods_k8s-kube-node2'=66;;;0;110
Node 'k8s-kube-master' Status is 'Ready', New Pods Schedulable : true - Pods Allocation Capacity : 110, Allocated : 25 (36.00%)
Node 'k8s-kube-node1' Status is 'Ready', New Pods Schedulable : true - Pods Allocation Capacity : 110, Allocated : 55 (50.00%)
Node 'k8s-kube-node2' Status is 'Ready', New Pods Schedulable : true - Pods Allocation Capacity : 110, Allocated : 66 (60.00%)
Great! Our 3 nodes are OK and we precisely know their pods allocation details.
The plugin is installed and connects properly to Prometheus: it is now time to use the Plugin Pack to start monitoring our Kubernetes Cluster.
3. Using the Plugin Pack to start monitoring Kubernetes Clusters
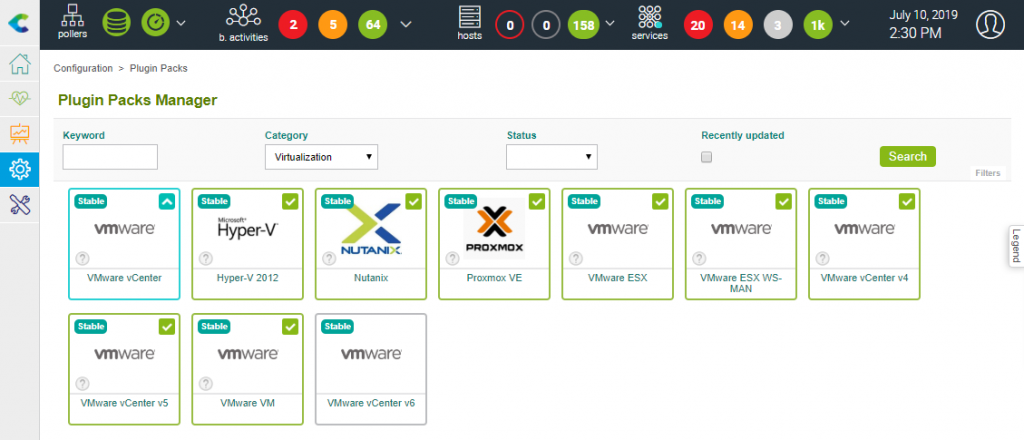
Plugin Pack Manager is the name of the Centreon user interface to list, download and update 300+ Plugin Packs.
- Read the Centreon Plugin Packs documentation to install the latest Plugin Packs if your platform is offline
From the Configuration > Plugin Packs > Manager user interface, search for kubernetes:
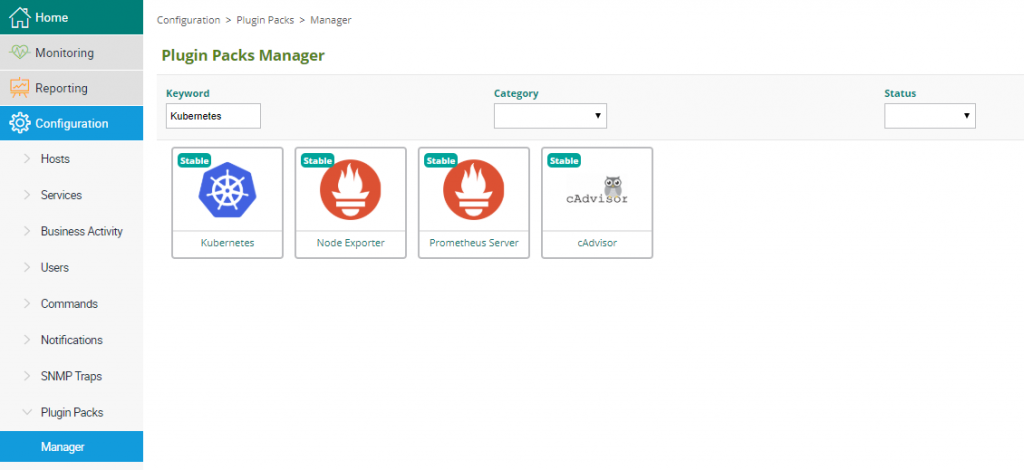
- Install the Kubernetes pack by clicking on the ‘+’ button
- As usual, the ‘?’ button will automatically redirects to the relevant Monitoring Procedure, including how to install the relevant Plugin
If the installation has been completed properly, you should find the host template Cloud-Prometheus-Kubernetes-Api-custom in the Configuration > Hosts > Templates menu.
To monitor your Kubernetes cluster, you need to create a new host with this template, with the following MACRO parameters:
- PROMETHEUSAPIURL: API and version you want to use (default /api/v1)
- PROMETHEUSAPIPORT: Listening API port (default 9090)
- PROMETHEUSAPIPROTO: Protocol used (http or https)
Make sure you check the option to Create Services linked to the Template too: this will automatically create and configure the Services defined by the 5 Service Templates included in the Plugin Pack:
- Cloud-Prometheus-Kubernetes-Namespace-Status-Api-custom for Namespaces monitoring
- Cloud-Prometheus-Kubernetes-Node-Status-Api-custom to monitor the cluster nodes
- Cloud-Prometheus-Kubernetes-Deployment-Status-Api-custom to monitor the Deployments
- Cloud-Prometheus-Kubernetes-Daemonset-Status-Api-custom for Daemonsets monitoring
- Cloud-Prometheus-Kubernetes-Container-Status-Api-custom for Pods and Containers monitoring
You are now ready to generate the configuration, export it and send it to the Poller:
- Follow the two steps of the Deploying Configuration procedure in the Centreon documentation.
You may verify Centreon is collecting metrics for your cluster in the Monitoring > Status Details > Hosts user interface:

Done! You are now monitoring your Kubernetes cluster through Prometheus.
4. Detailing the metrics Centreon is monitoring
Metrics were chosen to check the main components of Kubernetes. All metrics collected are described in detail in the kube-state-metrics GitHub documentation. By default, all metrics are collected. It’s possible to configure filters in PromQL format to collect particular monitoring dimensions.
Namespace-Status Service
Kubernetes Namespaces are useful to divide a physical cluster into multiple virtual clusters. This is typically used in development environments.
The Namespace-Status service monitors each Namespace and alerts if one or more namespaces is not in the Active status.
| Centreon metrics name | legacy kube-state-metrics | Type |
| – status | kube_namespace_status_phase | status string |
Node-Status Service
A Kubernetes cluster is made of nodes. The goal of Kubernetes is to schedule pods across nodes to share the load while achieving the deployments’ desired state.
- The Node-Status Service monitors the condition of each node: a node is in ready condition if it has enough resources to schedule pods. Otherwise, its condition indicates why it can’t schedule pods: no enough disk or memory, unavailable network, etc.
- A node may also be marked as unschedulable: this prevents new pods from being scheduled to that node, but does not affect any existing pods on the node.
- This service also monitors the number of pods (capacity) deployed on each node and compares this to the allocatable capacity of the node.
By default, alerts are triggered when the following conditions are met:
- At least one node in the cluster is not in ready condition
- At least one node is marked as unschedulable
- The percentage of allocatable pods being scheduled (capacity percent) reaches a threshold
| Centreon metrics name | legacy kube-state-metrics | Type |
| – status | kube_node_status_condition | status string |
| – schedulable | kube_node_spec_unschedulable | status string |
| – capacity | kube_node_status_capacity_pods | absolute |
| – allocatable | kube_node_status_allocatable_pods | absolute |
| – pods.allocated.count | kubelet_running_pod_count | absolute |
| – prct_allocated | N/A | percent |
Deployment-Status Service
Deployments are Kubernetes way of scaling containerized stateless applications. A deployment runs multiple replicas of the application pods across the cluster and automatically replaces any instances that fail or become unresponsive. The deployment ensures that the desired number of pods are running and available at all times.
The Deployment-Status Service monitors the status of all deployments on the cluster. It monitors that the current number of replica for a deployment matches its specified desired number. An alert is triggered when the current number is lower than the desired number.
| Nom métrique Centreon | legacy kube-state-metrics | Type |
| – deployment.replicas.desired.count | kube_deployment_spec_replicas | absolute |
| – deployment.replicas.current.count | kube_deployment_status_replicas | absolute |
| – deployment.replicas.available.count | kube_deployment_status_replicas_available | absolute |
| – deployment.replicas.unavailable.count | kube_deployment_status_replicas_unavailable | absolute |
| – deployment.replicas.uptodate.count | kube_deployment_status_replicas_updated | absolute |
Daemonset-Status Service
Deamonsets ensure that all (or some) nodes run a copy of some specific pods. This is useful to make sure each time a node is added to the cluster, some mandatory daemons are immediately spawn: a Prometheus Node Exporter monitoring daemon for example, or some log collection daemons such as fluentd or logstash.
The Daemonset-Status Service monitors the status of all daemonsets deployed on the cluster. It triggers an alert when the following conditions apply:
- Some daemonsets are unavailable (ie some nodes don’t run their pods)
- Some daemonsets are misscheduled (ie some nodes run pods they shouldn’t run)
| Centreon metrics name | legacy kube-state-metrics | Type |
| – daemonset.nodes.desired.count | kube_daemonset_status_desired_number_scheduled | absolute |
| – daemonset.nodes.current.count | kube_daemonset_status_current_number_scheduled | absolute |
| – daemonset.nodes.available.count | kube_daemonset_status_number_available | absolute |
| – daemonset.nodes.unavailable.count | kube_daemonset_status_number_unavailable | absolute |
| – daemonset.nodes.uptodate.count | kube_daemonset_updated_number_scheduled | absolute |
| – daemonset.nodes.ready.count | kube_daemonset_status_number_ready | absolute |
| – daemonset.nodes.misscheduled.count | kube_daemonset_status_number_misscheduled | absolute |
Container-Status Service
Containers are grouped into pods. While Kubernetes orchestrate the scheduling of pods accross all the nodes in the cluster, the containers in each of the pods have a status: ready, running, terminated, waiting, restarted.
The Container-Status Service monitors over time the number of pods in each status,
These metrics related to pods and containers status. It’s possible to alert on:
- States and status of pod’s containers (running, stopped, ready, etc.) and the reason for this status when it’s necessary.
- The number of restart for each container.
| Centreon metrics name | legacy kube-state-metrics | Type |
| – status | kube_pod_container_status_running, kube_pod_container_status_waiting, kube_pod_container_status_terminated | status string |
| – reason | kube_pod_container_status_terminated_reason, kube_pod_container_status_waiting_reason | status string |
| – state | kube_pod_container_status_ready | status string |
| – containers.restarts.count | kube_pod_container_status_restarts_total | absolute |
5. What’s next?
Viewing the availability and performance of your Kubernetes infrastructure
From there on, you can build views to see and share the performance and availability of your Kubernetes cluster using Centreon dedicated tools: Custom View for tactical dashboards, MAP for graphical dashboards and MBI for weekly and monthly analytics reports.
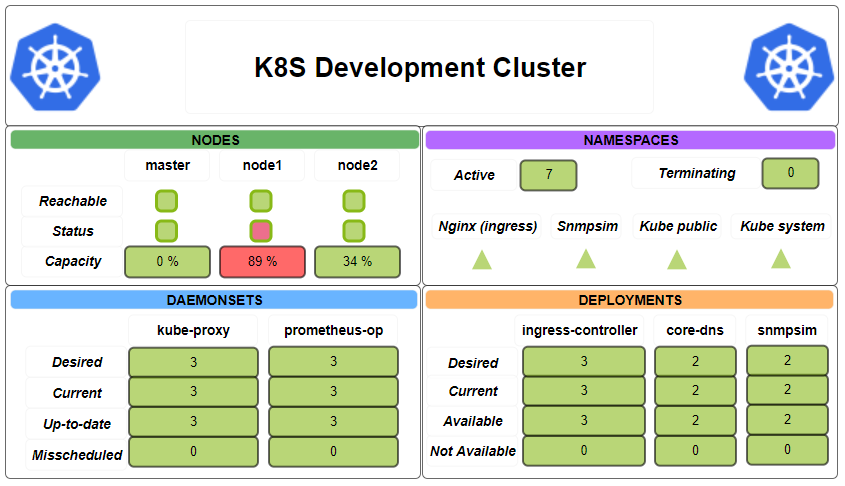
Extending the monitoring to individual nodes or to applications
In this tutorial we focused on monitoring the overall cluster and its orchestration function. Other Centreon Plugins and Plugin Packs let you extend the monitoring beyond the cluster itself:
- Node Exporter Plugin Pack / Cloud-Prometheus-Node-Exporter-Api Plugin: to monitor the system metrics of each node individually (CPU, Load, Memory, Storage)
- cAdvisor Plugin Pack / Cloud-Prometheus-cAdvisor-Api Plugin: to deep dive into the resource consumption of your applications containers (CPU, Load, Memory, Storage)
- Prometheus Plugin Plack / Cloud-Prometheus-Api Plugin: to monitor the health of your Prometheus server, or to access any custom metrics using your own PromQL query
Playing around with Docker without a full Kubernetes + Prometheus infrastructure? We also provide a Plugin Pack that directly connects to the Docker API:
- Docker Plugin Pack / App-Docker-Restapi Plugin: to check Docker Nodes connecting to the Doker Rest API
Your turn to play with Centreon
- Download Centreon.
- Check our tutorials catalog including: Monitoring AWS, Monitoring Microsoft Azure…


